At some point in the many months of lockdown I had been introduced to the card game called Cribbage by my friend Anna. The surplus of free time that came with the lockdown implied that I ended up playing this new (to me) game a lot. We didn’t have a board at home (if you’re not familiar with the game this will become clear below), so we thought we could simply write our points down on a piece of paper, just like any traditional point keeping game from the stone age. This meant that we created a decently sized dataset for the amount of points earned during each round, something not readily available when one plays the game with a board.
I soon began wondering about the distribution of points earned. How many points do I get on an average round? How often am I exceeding this number? What is the maximum number of points I can score in one round? Are all the scores between 0 and this maximum attainable? Before answering these questions, let us first introduce the game. If you’re acquainted with the game you can skip straight ahead to the Results.
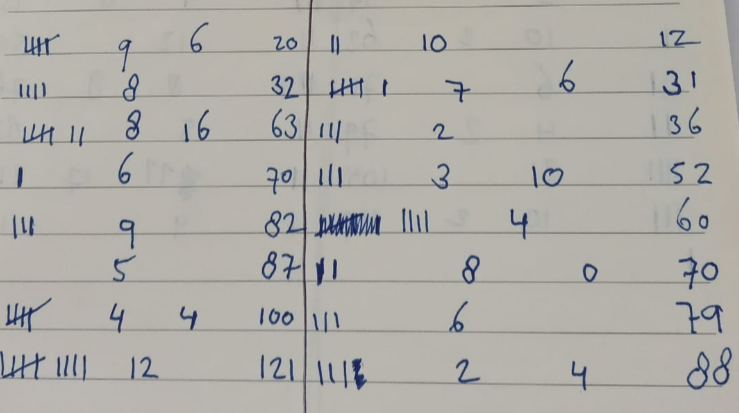
Our scores; first column: pegging points marked down in real time, second column: hand scores, third column: crib scores, fourth column: total cumulative score.
Rules of the game
We will be concerned with the 2-player version of this game for which we explain the rules briefly here, and refer the reader to pagat.com for more extensive information.
Cribbage is a card game involving the whole deck. Points are kept using pegs on a board which is shown in the figure below, and the objective of the game is to be the first player to get 121 points, in this case to be the first one to travel beyond the end of the board. One point corresponds to one step travelled on the board.
A cribbage board
An example of the board on which the points cribbage are counted on. Image taken from cardgames.io, where you can also play this game online if no cribbage partners are to be found around. More examples of boards can be found in any website selling them.
The game is comprised of 3 parts; the deal, the play, and the show.
The Deal
The game begins by determining the dealer, who is the player who draws the card of lowest value. The order of ranks in decreasing order is as K Q J 10 9 8 7 6 5 4 3 2 A. The dealer then deals six cards to each player, and in each subsequent round the two players alternate in the dealer’s position.
Each player then discards 2 cards out of their hand of 6. The total of 4 discarded cards then go to the crib, which belongs to the dealer of the corresponding round. We will refer to the cards a player has chosen to keep as their hand.
The non-dealer then cuts the deck, and the top card of the lower deck is then turned around and placed on top of the deck. We will refer to this card as the top card. If this card is a Jack, the dealer immediately pegs (game jargon; = receives) 2 points.
The Play
Then, the play of the round can begin. The non-dealer plays the first card, playing it face up on their side of the table. It is then the dealer’s turn, who also plays the card on their side of the table. After a player plays a card they announce the sum of the values of the cards played. The King, Queen and Jack all have a value of 10, and Aces have a value of 1. The rest of the cards have their face value. This sum must never exceed 31. The two players alternate in turns until a player cannot play a card such that this sum is not exceeded. When this happens they say ‘Go’, and the other player has the chance to play if they have such a card. If they do not have such a card they peg 1 point immediately and the score goes back to 0 and the count starts over, with the latter player starting the play. If they have such a card they have to play it, and this keeps on going until they run out of cards they can play while staying under 31. If they do reach 31 points exactly, they peg 2 points, and if they otherwise stay below 31 they peg 1 point just like the previous case. The score then goes back to 0 and it is the next player’s turn.
During the play of the cards, the players can peg points in the following ways:
- Fifteen: If a player plays a card which brings the score to 15, they peg 2 points.
- Thirty-one: As mentioned already, if a player plays a card which brings the score to 31, they peg 2 points.
- Last Card: As mentioned already, the player who plays the last card before the sum of 31 is exceeded pegs 1 point.
- Pair: If a player plays a card which is the same rank as the previous card, they peg 2 points.
- Pair Royal: If a card of the same rank is played for the 3rd time in a row, the player pegs 6 points.
- Double Pair Royal: If a card of the same rank is played for the 4th time in a row, the player pegs 12 points.
- Run: If at any point consecutive cards form a sequence in ranks in any order, then the player who played the card to complete such a sequence pegs as many points as the run is long. For example, if Player 1 plays a
3, Player 24, and then Player 1 plays a2, then Player 1 pegs 3 points. If then Player 2 plays a5, they then earn 4 points.
These points are pegged in real time.
The Show
After all 4 cards of each player have been played, they retrieve their cards. Now, they can collect points based on their hands, with the addition of the top card. It is first the non-dealer’s turn to do so, and again the points are pegged as they are counted. Then, the dealer counts the points of their hand first, and then of their crib. It is important that the points are pegged in real time, because it means that a player can win (or lose) dependent on whose turn it is to play.
A player can collect points if any of the following are satisfied in their set of cards (hand or crib):
-
Fifteen: Any collection of cards which sums up to 15 earns 2 points.
-
Pair: Any pair of cards of the same rank earns 2 points. This means that 2 cards of the same rank earn 2 points, 3 cards of the same rank earn 6 points, and 4 cards of the same rank earn 12 points. (This follows from a quick combinatorial argument: . If you are unfamiliar with the notation etc., it is mathematical language for answering the question: In how many different ways can I choose 2 items (in this case cards) out of 3? The general form is where an exclamation mark denotes a factorial, that is, a number shouting loud by multiplying itself with all the positive integers smaller than itself ().)
-
Run: A player earns as many points as the length of the longest run their cards can produce, in order of rank and irrespective of suit. For example
2-3-4would earn 3 points;2-3-4-5would earn 4 points. -
Flush: If all the cards in a players hand are the same suit, they earn 4 points. If in addition the top card is of the same suit, they earn 5 points. When counting the points in the crib however, only the latter can contribute, i.e., if a player has a flush in their crib but the top card is of different suit then this scores no points. If the flush matches the suit of the top card then they earn 5 points.
-
One for his nob: If the hand or crib contains the Jack of the same suit as the top card, the player earns 1 point.
Finally, before delving in what comes next, it is probably more rewarding to do so after familiarising yourself with the game.
Results
In general, one would want to optimise the points they will earn. This means maximising the number of points they receive through their hand. In addition, a dealer would want to maximise the (potential) points in the crib whereas the non-dealer would want to minimise this potential. Thus, presumably, the choice of cards to keep or discard is not random. By the end of this section we will see that it does indeed not appear random.
How many points in one round?
At any point of point evaluation, a player has 5 cards to gather points from - 4 from their hand (or crib) and one from the top of the deck.
Making the most of one’s hand
What is the maximum amount of points one can earn from their hand? We will answer this question by first making an educated guess about this number by constructing what we think the ideal situation in our hand is. We will then show that we could never possibly exceed this number. This is a common technique in mathematics that is used to prove that something is a maximum.
In this game, I always look for 5’s; since the 10, Jack, Queen, and King all have a face value of 10, it means that having a 5 gives one a much higher chance of forming a 15 than with any other card, as a value of 10 is more likely to occur than any other value. More explicitly, 4/13 cards have a value of 10, and every other value occurs with a probability of 1/13. Also, three 5s make Fifteen.
Claim.
Three
5’s is the most profitable collection of 3 cards.
Proof.
Firstly, let us calculate how many points this is. We have a Fifteen, which gives us 2 points, and 3 of a kind, which gives us 6 points. This is a total of 8 points.
Any other collection of 3 cards must either give Fifteens, or contain a run in order to give us points. The most profitable runs of 4 cards come to 5 points and are given by 4-5-6, 6-7-8, and 7-8-9, where we get 3 points for the run and 2 points for the Fifteen. All other runs come to a maximum of 3 points. (We are calculating points here solely based on 3 cards, so ignoring any top card related things that could arise from Jacks; in any case that would only incur one point more so it doesn’t affect our statement.) If we are to make Fifteen, then this would be by addition of 2 cards, such as 5+10, 6+9,7+8. We optimise this by having double of one of these cards; this yields a total of points from the Fifteens, and 2 points from the double, giving a total of 6 points.
Any other combination of 3 cards is thus less than 8 points, and the claim has been proved.
While we have shown that the most profitable collection of 3 cards is 3 5’s, this can only serve as a good guide going forward. Almost certainly, such information will make us include 3 5’s in our collection of 5 cards, but that is not necessarily the case for other games where point keeping is different.
There are 4 5s in the deck, and the best number to combine a 5 with is a card with value 10. Consider 4 5s and a 10; this gives points for Fifteens coming from the 5s, 12 points from Four of a kind, and from Fifteens of the 10-card and a 5. This yields a total of 28 points.
Is that then, the most points that 5 cards can give us?
We can in fact squeeze one more point out of a 5-card collection! This can only be done using the one way of scoring we haven’t yet: One for his nob. Having the arrangement of cards such that we have a Jack in our hand, and then the top card being a 5 of the same suit gives points. We claim now that this is the highest score one can possibly obtain in their hand.
Let us thus show why no other collection of 5 cards can exceed this score. Without being too rigorous about this, let us choose some other profitable set of cards. One could calculate all the possible scores (which is done below), but we can also think what cards are the best ones to include in the most profitable hand. Firstly, cards with value less than 5 are not as profitable, due to the fact that more of them are needed to make Fifteen. Thus if the ‘profit’ of such a hand would come from a pair, this can be achieved with cards of higher value. Also, having a pair means that we cannot have a flush. A pair is more profitable than a flush when there is at least 3 of the same kind. A flush is most profitable when it also includes a run, ideally of maximal length (=5, since we have a total of 5 cards). Let’s see the two cases more closely:
Case 1: Flush and run
The most profitable run of 4 is 6-7-8-9; we have 4 for the run and for the two Fifteens, and 4 from the flush. That is the maximum number of Fifteens we can have, if we are also to have a run. Then adding a number before or after will not give another Fifteen, but will increase the run value to 5. This then gives a total of 13 points. The 13 points for this kind of hand can similarly be achieved with the run 4-5-6-7-8.
The maximum number of Fifteens achievable in any collection of 5 distinct cards is 2. Therefore the maximum is achieved by the 13. This is less than 29.
Case 2: Four of a kind
Consider any other collection of 4 numbers that is not a 5. The way to make this most profitable is by combining the numbers in the collection with a number that gives the sum 15. For example, 6 and 9 or 7 and 8. Making combinations of any of these two pairs gives 12 points from the four of a kind and from the Fifteens. This gives a total of 20 points, which is less than 29.
Conclusion.
The most profitable hand is 3
5’s and aJ, with the top card being a5of the same suit as theJ. This yields a total of 29 points.
An average hand
Another thing that we often wonder is if we are above average. Or, if our hands are.
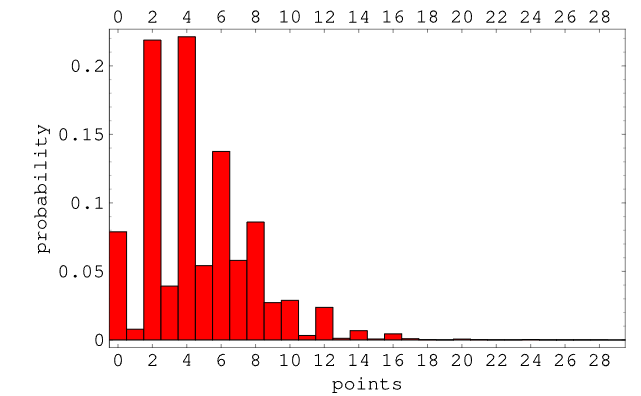
When I first began wondering about the average scores and relevant distributions, I looked for what WolframAlpha had to offer. Without a doubt, I found a distribution of scores:
Distribution of Cribbage scores (taken from Wolfram)
This graph shows the distribution of scores, provided one picks their hand randomly. However, when one plays the game, one is presumably trying to maximise this score. The aim of the game is to win (typical) and one is thus choosing the cards in their hand not at random. Of course, the cards are dealt at random, but after that the player has the choice to optimise the 4 cards they are left with. This choice is most likely going to give them a higher score than closing their eyes and picking 4 out of the 6 cards at random. The reason this statement cannot be absolute is because when the players choose their hand cards, the top card is still unknown.
For the purposes of comparing the scores obtained by us, I have recreated the above plot. You can find the python code for counting the points in a hand in my github page, which can also be used to determine the score of a hand.
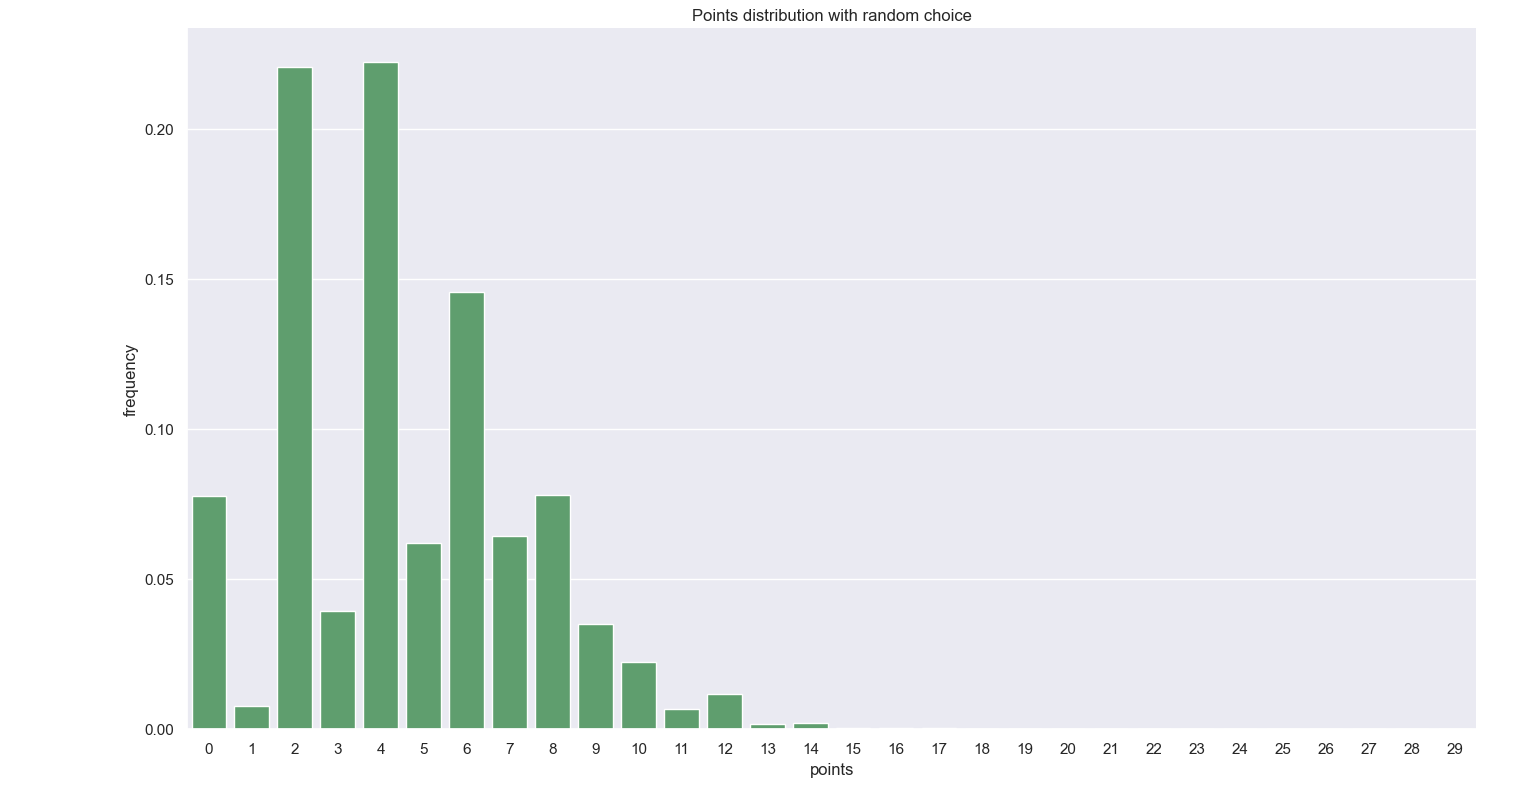
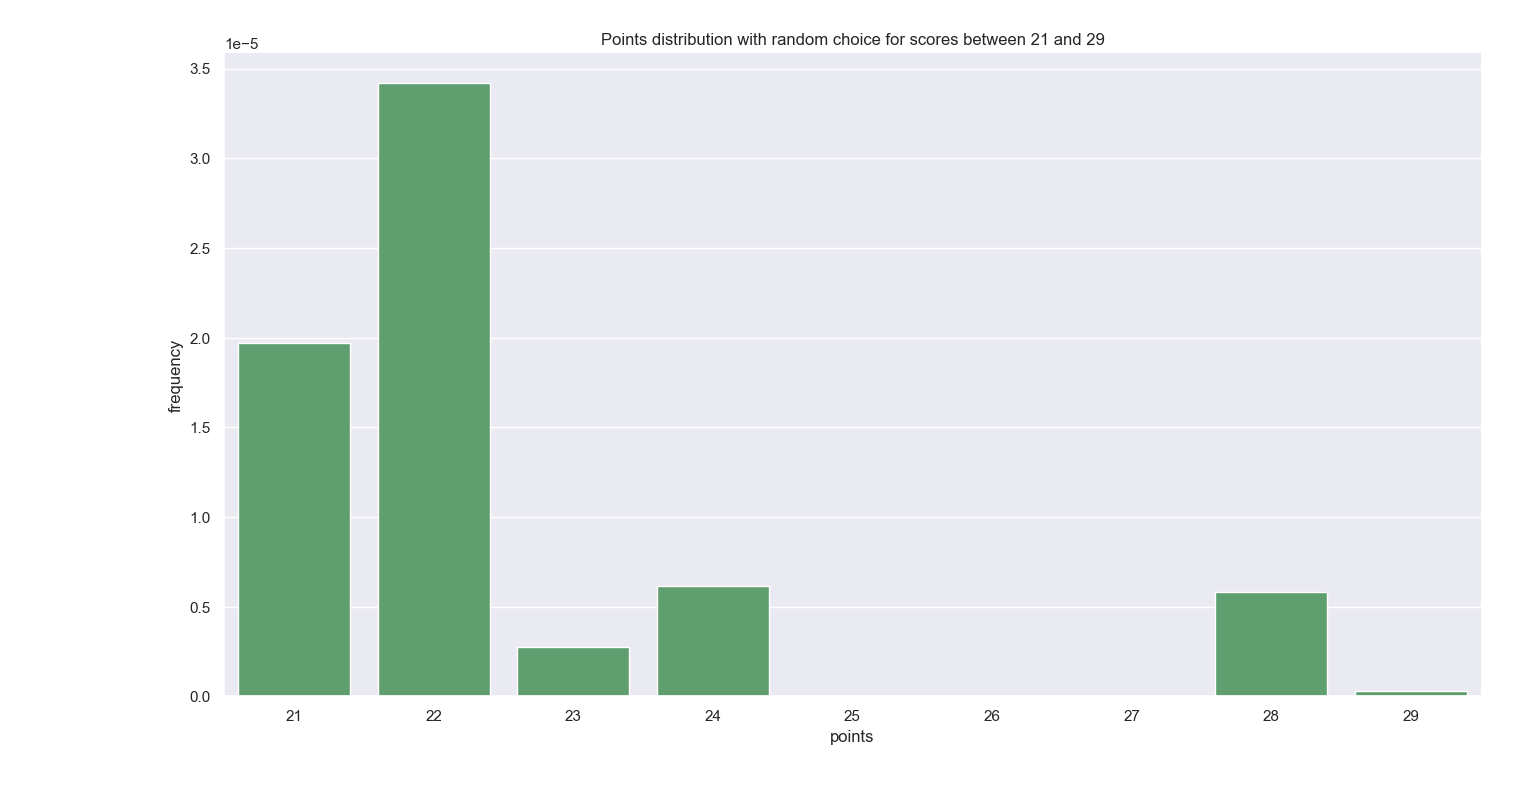
Without further digression, let us have a look at the plots, as shown below. Firstly, the total points distribution, assuming hands are chosen at random. I have zoomed in on the points on the higher end to highlight something quite interesting: the maximum possible score is 29, and the scores 19, 25, 26, 27 are impossible to attain. To see analytically that these scores are indeed unattainable is a straightforward yet tedious combinatorial exercise which is neither illuminating nor fun, and resembles the proof of the fact that the highest score is 29. However, since this is also shown by calculating all of the scores, it is an exercise that I’m willing to spare.
Another notable fact is how much more likely a score of 28 is than that of 29. The only difference between a score of 28 and that of 29 is the nob point - a matching suit between the Jack in hand and the card on top of the deck. That makes a score of 28 76/4=19 times more likely than 29. I have yet to score a 28 or witnessed anyone doing so, despite this 19-tuple strength.
Distributions when hands are chosen at random, at scale and zoomed in.
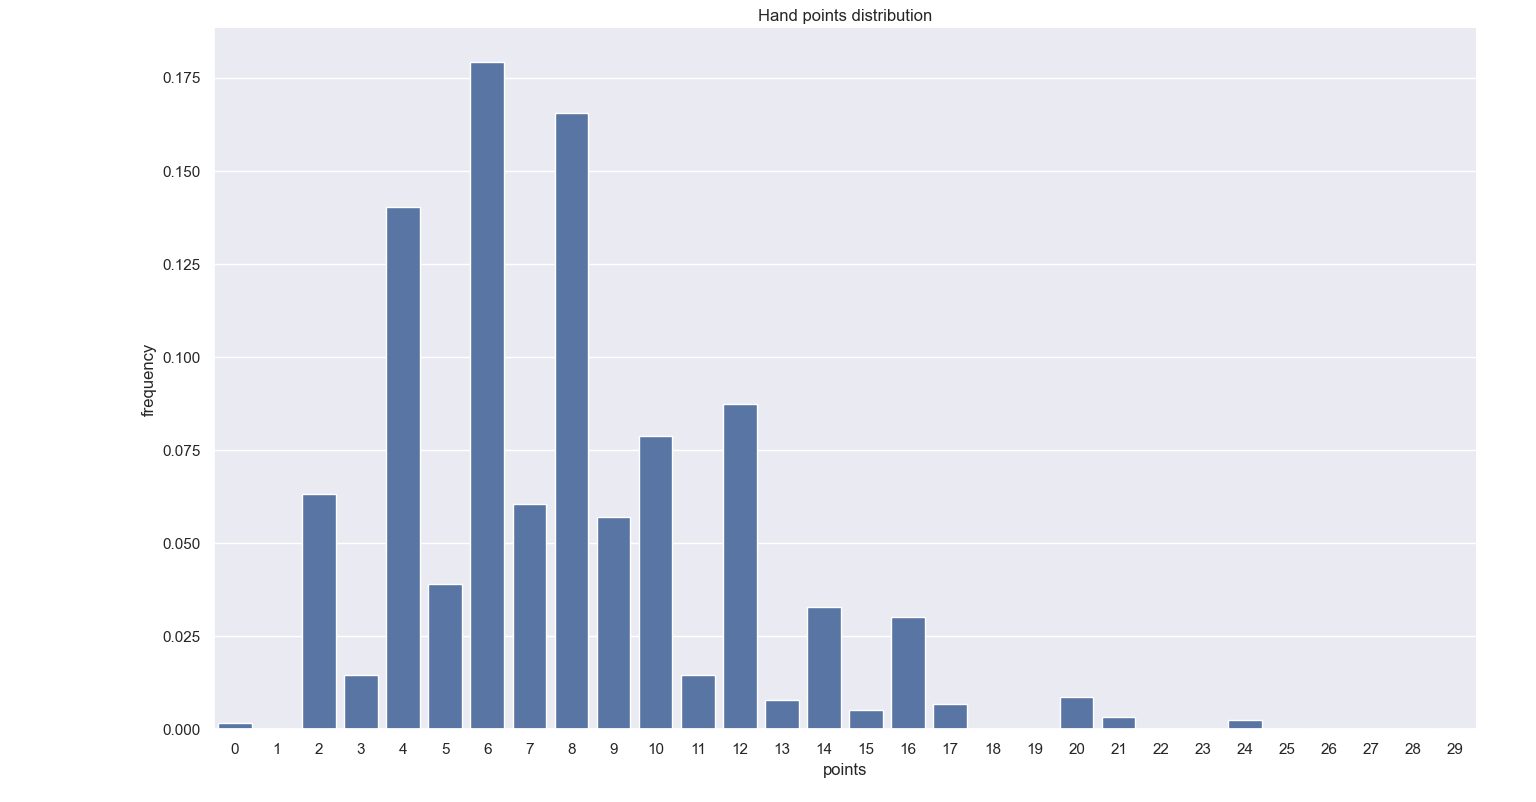
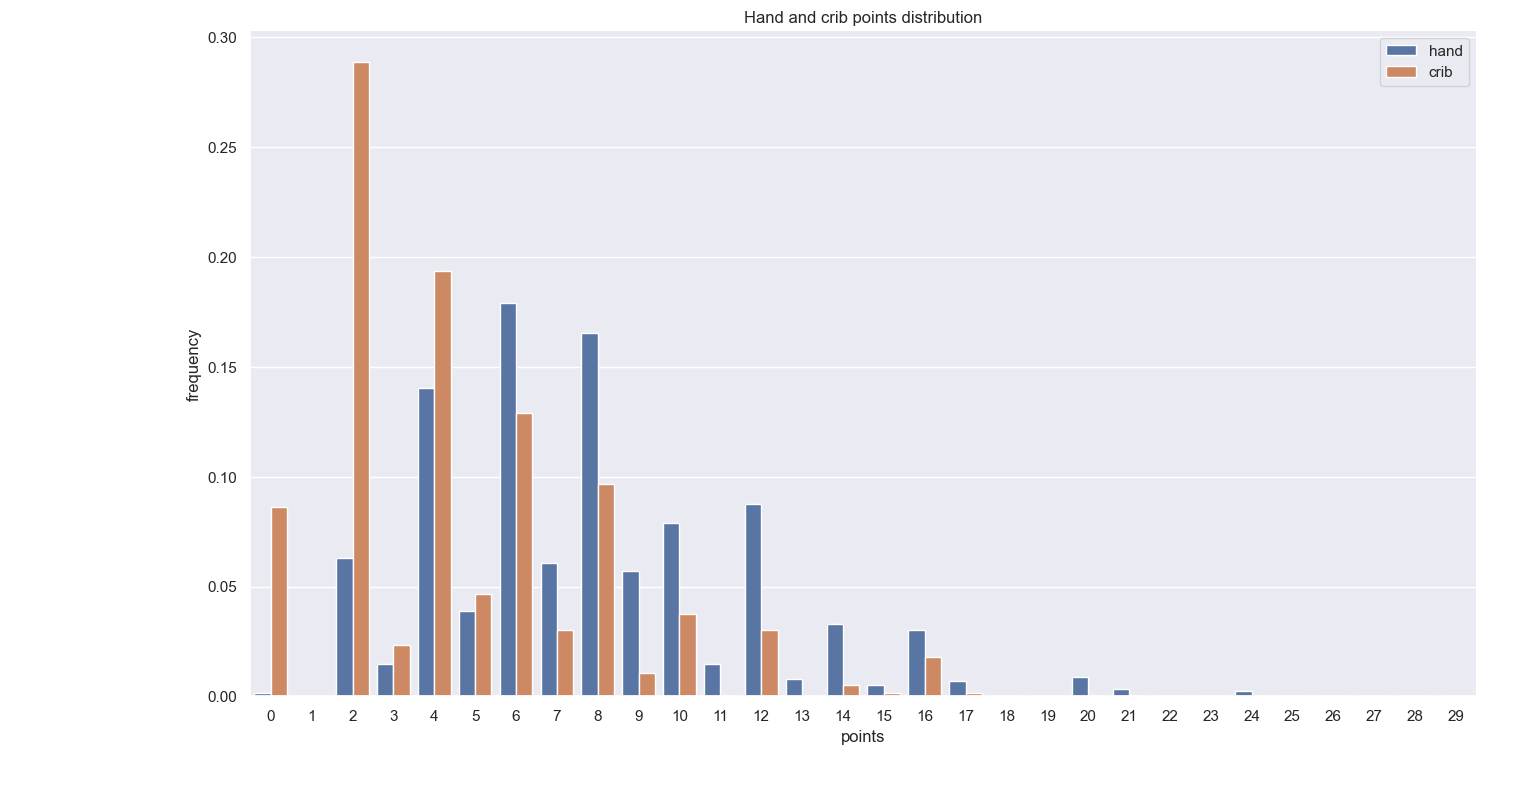
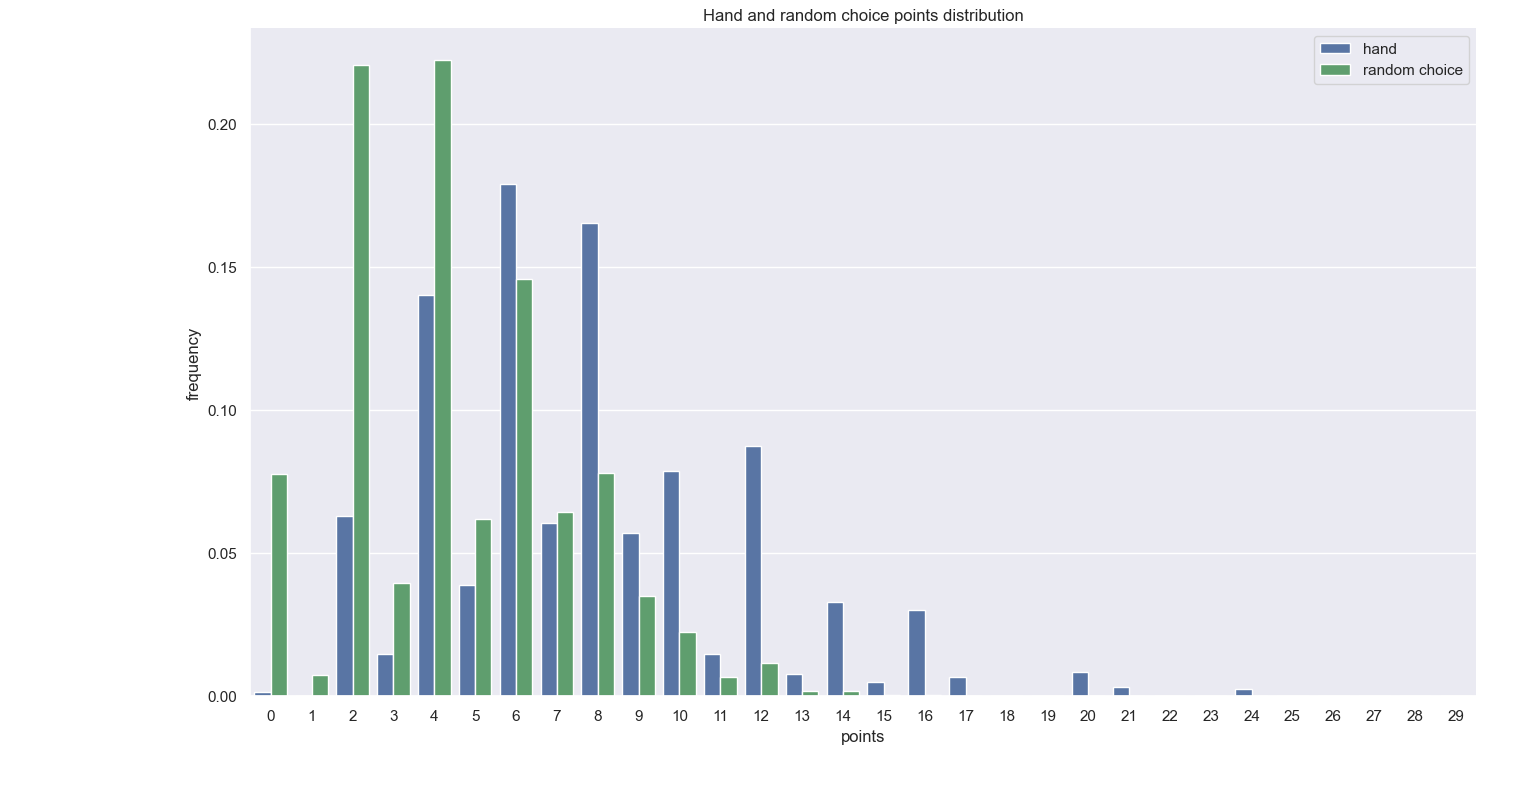
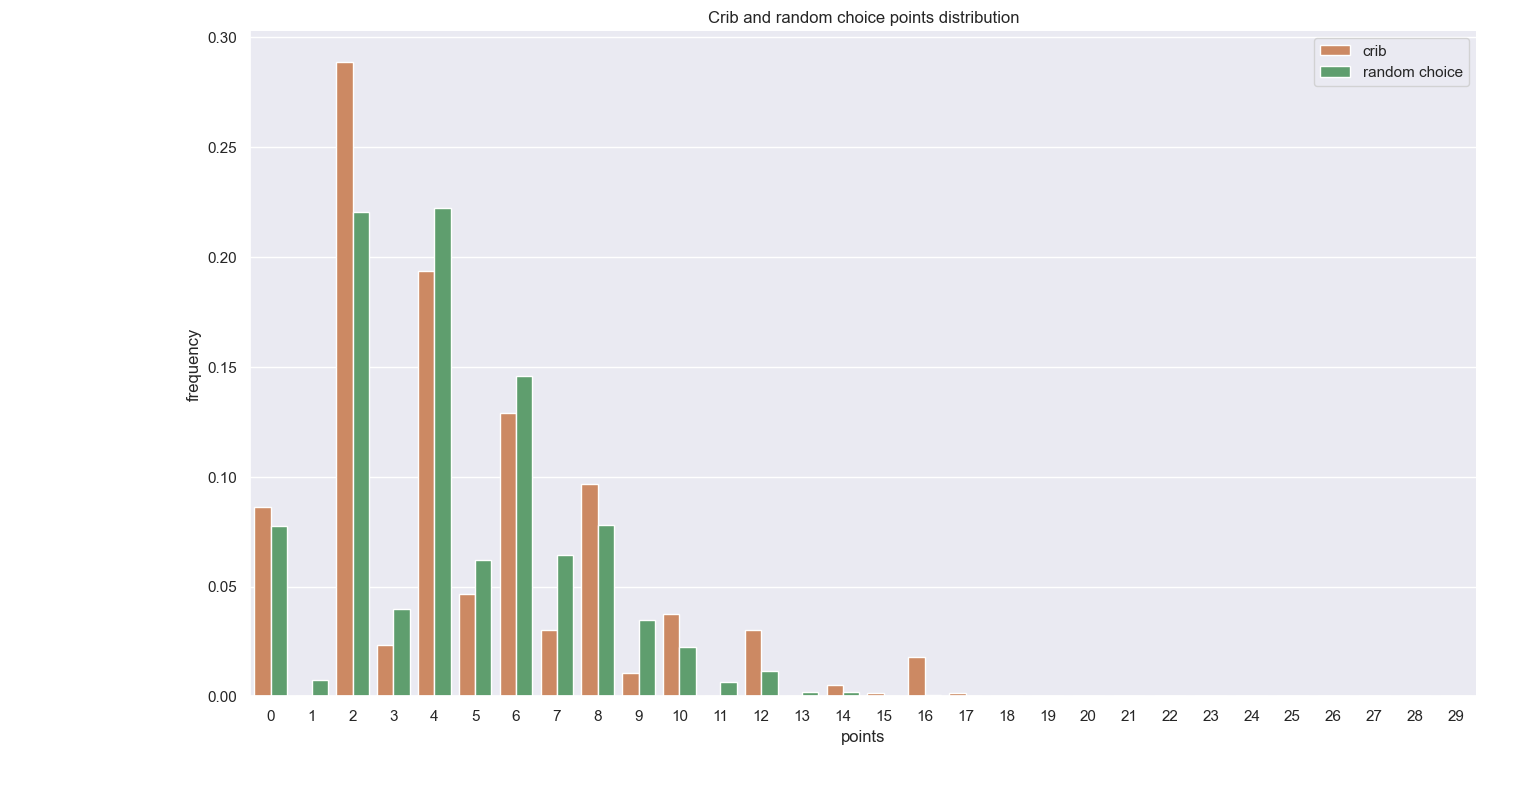
Let us then see how our scientifically driven results differ from this distribution. The figures below show the the distributions of the scores in the hand and crib respectively, and a final figure shows the two distributions together, to get a first glimpse at they compare. As anticipated, the scores from the cards in hand seem to be higher in general. Something to keep in mind when looking at these graphs is that the set of crib scores obtained is half of that of the hand. This is not a full statistical study so the effect of the results on the population size is not something that interests me at the moment. Still, the probabilities are not affected by the different population size, it’s just that ‘outlier’ behaviour may appear more significant in the crib distributions, than in the hand distributions.
Hand distribution
Crib distribution
Distributions of the scores obtained in the hand and crib
What is more interesting, however, is how these two sets compare to the one of random choices:
Distribution of the scores obtained in the hand and random choice.
Distribution of the scores obtained in the crib and random choice.
We can see that the distribution of the scores in the crib are very close to the random distribution. This is to be expected, as the cards that are in the crib are the ‘mixed discarded’ cards. The player whose crib it is can try and optimise this choice, but the opponent naturally would try to make their worst in choosing which cards to give away. Some basic statistics highlight this:
| random choice | hand | crib | |
|---|---|---|---|
| mean | 4.6 | 7.8 | 4.7 |
| s.d. | 7.8 | 14.6 | 11.7 |
While these are indeed numbers, they are crude for understanding the connections and differences between the three distributions. Indeed, the hand has the highest mean, and the crib and random choice appear to be close. That is making me feel confident in our hand-picking abilities. All I’m learning from this table is that if during a game I close my eyes and pick my cards, I’m likely to score lower. I am thus inclined to believe that Anna and I know how to pick our hand well.
Hand Vs Crib Vs Random choice
Without getting too much into unnecessary details, I tried to determine the extent to which the hand or crib points follow the distribution from random choice. This was done using what is called the chi-squared test (-test), and to no surprise the result was that they most likely do not follow that distribution, and that the crib distribution is far closer to the random distribution rather than the hand. (If you are interested in learning more about this type of test, there are plenty of resources online, and the course on Khan Academy gives a good hands-on introduction.) To make this process and somewhat more explicit, the test mentioned outputs a number, that we call the test statistic. The closer the test statistic is to 0, the more likely it is that the two distributions are the same. Formal suit and tie statistics often say that values larger than ~40 (in this case) suggest that the distributions differ. The test statistic for the crib scores was 356, and for the hand scores 5857. This is a massive difference in the degree the two distributions agree to the random choice one.
Another number this test outputs is what is called a p-value, which is fancy language (or shorthand?) for saying: probability that the two distributions we have observed are the same, and the differences are due to variations that occur naturally due to the inherent randomness in the phenomenon we are studying. The p-value for the crib comparison is of the order of , while the p-value for the hand comparison is so small that my computer couldn’t distinguish it from 0. These numbers just mean that it’s extremely unlikely that they are the same, but statistical tests only show the likelihood of something as opposed to absolute truth, which is why language such as ‘likely’ is used. In any case, this gives me a lot of confidence that the hand and crib distributions vary significantly from the random choice distribution.
There exists the degree of skewness of data, which measures the degree of asymmetry. In this case, the more positive this value is, the more this data is shifted to the right (that is, towards higher scores) of the most common value (we call this the mode). While we can qualitatively get an idea about this from the graphs, this number lets us see how the datasets differ with more confidence. The values are:
| random choice | hand | crib | |
|---|---|---|---|
| skew value | 0.6 | 0.9 | 1.1 |
| mode | 4 | 6 | 2 |
Since the random choice and crib points have very similar means, even though the mode is less for the crib, the difference in the degree of skewness suggests that the crib scores are, in everyday language, better than choosing randomly.
The higher mean, mode, and combined with the relatively high value of skewness observed for the hand implies that, thankfully, hand scores generally are the best out of the three.
Even Vs Odd
Something else that I noticed is the fact that even scores seem much more likely to achieve rather than odd scores. In numbers, this is
| random choice | hand | crib | |
|---|---|---|---|
| probability of even score | 78% | 79% | 88% |
Comparing the even (resp. odd) scores distribution shows that generally the odd distributions are better matched, even though never really convincingly matching, for both hand and crib scores. This is quantitatively shown in the table below:
| test statistic | p-value | |
|---|---|---|
| full hand | ”” | |
| full crib | ||
| even hand | ”” | |
| even crib | ||
| odd hand | ||
| odd crib |
These numbers are hardly interesting or important, but they can help paint a picture; odd scores are a tiny bit more matching to a random distribution than even ones for hand scores, but a lot more matching for crib scores.
All in all, it looks like our hand picking strategies have been serving us well.
